What determines organ size?
It is not known how organ size is regulated, so how organs ‘know’ when to stop growing. For the wing imaginal disc of Drosophila it has been proposed that mechanical forces play a role. According to these models, growth factor gradients induce growth in the center of the disc, causing the build-up of mechanical stress, which then feedback on growth in turn. An increase in compression in the center is hypothesized to inhibit growth and terminate it in the end. Since mechanical forces affect cell shape, these models predict a decrease in apical cell area in the center as the disc grows.
Analyze the data in order to find out whether cell shape areas are decreasing in the center of the wing imaginal disc over time.
More details:
- Calculate cell areas of the late disc (µm2)
- Calculate positions of cell centers (assume that the disc center is at (0,0))
- Draw the wing disc: make area dependent cell colors
- Plot cell area against distance from disc center
- Add a linear fit through the data to this plot
- Determine a P-value for the correlation using a Spearman's rank test
- Which assumption does the Spearman's rank test make about the distribution of the data?
- Use a Student's t-test in order to test whether cells up to half the maximum wing disc radius have areas that are significantly different from those of the cells further away from the center
- Which assumption does the Student's t-test make about the distribution of the data?
- Perform the same analysis for the early disc. Conclusion?
- Optional question: explain equation for polygon area
Further information
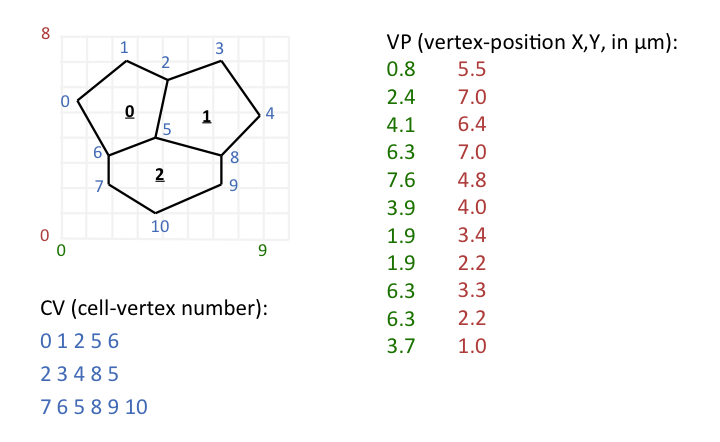
Here is a hypothetical example to illustrate the meaning of CV and VP:
Equations for polygon area and center of mass:
| A = -1/2 ∑i=0..N-1 (xi yi+1 - xi+1 yi) |
| cx = -1/(6A) ∑i=0..N-1 (xi + xi+1) (xi yi+1 - xi+1 yi) |
| cy = -1/(6A) ∑i=0..N-1 (yi + yi+1) (xi yi+1 - xi+1 yi) |
See also here
The following code illustrates how polygons can be drawn using the matplotlib library:
from matplotlib.patches import Polygon
from matplotlib.collections import PatchCollection
import pylab

triangle_positions = [[0,0],[0.3,0.3],[0.5,0.1]]
square_positions = [[0.5,0.1],[0.3,0.3],[0.6,0.5],[0.8,0.4]]

patches = []
patches.append(Polygon(triangle_positions))
patches.append(Polygon(square_positions))

p = PatchCollection(patches)
p.set_array(pylab.array([1,3])) #for colors
fig=pylab.figure()
panel=fig.add_subplot(111)
panel.add_collection(p)
panel.set_xlim(0,1)
panel.set_ylim(0,0.7)
panel.set_aspect(1)
pylab.colorbar(p)
pylab.show()
The numpy.polyfit(x,y,deg) function returns an array
of polynomial coefficients such that
p(x) = p[0] * x**deg + ... + p[deg]
is a least-squares fit to the points (x,y).
(Full
documentation.) The coefficients are ordered as highest power
first.
The Spearman's rank correlation coefficient and the p-value for non-correlation can be calculated using scipy.stats.spearmanr(x,y). Documentation can be found here.
A t-test for two independent samples can be performed using scipy.stats.ttest_ind(a, b). It returns the t-statistic and the two-tailed p-value. Documentation can be found here.
max() and min() can be used to find the maximum and mimimum array value, respectively.
Thanks to Maria Heimlicher, the Basler lab and the Aegerter lab!
Further reading: Original paper with cellular model and cell shape analysis